

Forex
+100 Assets
Content table
15 hours ago
7 Minutes read
Written by Greenup24
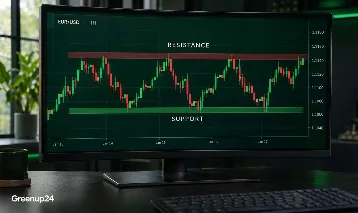
Price reaches a familiar area where it has changed direction several times before. Will it reverse again, or break through and begin a new move? Support and resistance provide a framework for assessing that question.
These zones help with more than finding an entry. They can also help define where a trade idea becomes invalid, where price might react next, and whether the potential reward justifies the risk. In this Greenup24 guide, we explain how to identify and use support and resistance with practical examples.
Support is an area where buying interest or easing selling pressure may prevent price from falling further. Resistance is an area where selling interest or weakening demand may interrupt a price rise.
Suppose EUR/USD has fallen towards 1.0800 several times and then recovered. That history makes the area around 1.0800 a potential support zone. If rallies have repeatedly stalled near 1.0900, that area may act as resistance.
Treat these areas as zones. Price does not necessarily stop at one exact number and may move slightly beyond a zone before reversing.
All prices and scenarios in this article are hypothetical and provided for educational purposes.
Previous highs and lows, traders’ entry prices and round numbers can influence future decisions. Some traders buy near a previous low, while others close short positions in the same area. Near a previous high, new sellers may enter and existing buyers may take profits.
These behaviours explain why price history deserves attention. However, orders, expectations and market conditions change. A previous reaction does not guarantee the same outcome next time.
Begin with the daily or four-hour chart and mark areas from which price made a clear move. Then switch to a lower timeframe to examine the details.
Draw a narrow rectangle around a cluster of nearby highs or lows. Base its boundaries on actual price reactions, rather than repeatedly adjusting them to fit every historical candle.
In an uptrend, connecting higher lows can create an upward-sloping support line. In a downtrend, connecting lower highs can reveal downward-sloping resistance. A parallel line on the opposite side of price can help outline a channel.
Previous highs and lows, trendlines and moving averages are common tools for identifying potential support and resistance.
A moving average shows the average price over a specified number of past candles. A 50-period moving average on an hourly chart is different from a 50-day moving average.
In some trends, price reacts near a moving average during a pullback. However, trading above the average is not a buy signal by itself. In a directionless market, price may repeatedly cross the line in both directions.
Fibonacci retracement tools help assess how far price has pulled back after a move. Common levels include 38.2%, 61.8% and 50%, although 50% is not a Fibonacci ratio.
If EUR/USD rises from 1.0500 to 1.1000, those retracement levels lie near 1.0809, 1.0750 and 1.0691 respectively. An overlap with a horizontal zone gives a trader another reason to examine the area; it does not justify an automatic entry.
Round numbers such as 1.1000 in EUR/USD can also attract attention, but not every round number is meaningful support or resistance.
Assess the quality of price reactions rather than simply counting touches:
More touches do not necessarily make a zone stronger. Reactions may weaken as price returns to the area with progressively smaller moves away. A fresh zone can also deserve attention after a single substantial reaction. A fixed requirement of “at least two touches” does not suit every situation.
This approach considers whether support or resistance will hold. Price reaching the zone is the starting point for assessment. A brief move beyond the area followed by a return, a candle closing in the opposite direction, or a break of a short-term swing high or low may form part of an entry condition.
For example, price enters support, forms a wick below it, and closes back above the zone. This may suggest rejection of lower prices, but support can still fail.
A breakout occurs when price moves beyond the boundary of support or resistance. Waiting for a candle to close outside the zone and examining the follow-through can help reduce impulsive decisions. A wick briefly crossing the boundary is not sufficient evidence of a new trend.
In forex, volume data often means tick volume: the number of price changes during a period, rather than the total volume traded across the global market. An increase should therefore not be treated as definitive evidence of money flowing into the entire market.
After breaking above resistance, price sometimes returns to the same area and rises again. Former resistance may then act as support. The reverse can happen after support breaks.
This return is called a retest. Retests do not always occur, and a return to the zone alone does not establish that a breakout has succeeded. The subsequent price reaction matters.
No. Support and resistance can be analysed using price action alone. Indicators are useful when they answer a specific question, such as a moving average helping assess trend direction or RSI helping assess momentum.
An overbought RSI reading is not a reason to sell by itself. It can persist during a strong trend. Agreement between several similar indicators also does not necessarily provide independent evidence.
First, define the price movement that would invalidate your analysis. For a buy trade near support, this might be below the zone and the low of the reaction. The appropriate distance depends on the instrument’s volatility and the timeframe.
ATR, or Average True Range, can help assess typical price fluctuations. However, a fixed ATR multiplier is not suitable for every instrument or market condition. A wider stop also requires a smaller position if the planned cash risk is to remain unchanged.
Position size is calculated by dividing the cash amount at risk by the loss per unit of position size at the stop-loss.
For example, suppose account equity is $1,000 and the trader chooses, for this illustration, to risk 0.5%, or $5. If the stop-loss is 25 pips from entry and each pip is worth $10 for one lot in that instrument and account currency:
Approximate position size = $5 ÷ (25 × $10) = 0.02 lots
This calculation excludes commission, slippage and other potential costs. For gold, indices and other CFDs, check the instrument’s tick value, contract size and specifications.
Set the target with reference to the nearest opposing zone. If there is little room before the next resistance area, placing a more distant target simply to create an attractive reward-to-risk ratio does not justify the trade. A risk-to-reward ratio of 1:2 means the planned profit is twice the planned loss; profitability also depends on the win rate and trading costs.
During news events or price gaps, a stop-loss may execute at a different price from the specified level. The actual loss can therefore exceed the initial estimate.
| Mistake | How to Address It |
|---|---|
| Drawing too many lines | Keep only relevant zones that have meaningfully influenced price. |
| Entering simply because price touches a zone | Define a clear entry condition in advance. |
| Ignoring higher timeframes | Check where price sits within the broader market structure before entering. |
| Placing a stop exactly on the zone boundary | Consider the invalidation point and typical price fluctuations. |
| Using the same position size with different stop distances | Recalculate position size from the planned cash risk. |
| Ignoring news and liquidity | Review the trading session and upcoming events. |
To practise in MetaTrader 5, start with an uncluttered chart. Mark two or three important zones and write down scenarios for both a hold and a break before price arrives. The platform provides drawing tools and indicators for this analysis.
When using a Greenup24 trading account, align your analysis with the prices and specifications of the actual instrument you trade. Include spreads, any applicable commission, and the difference between bid and ask prices in your entry and exit planning.
Before each trade, answer four questions: Where is the zone? What is the entry condition? What would invalidate the analysis? How much room is there before the next target? Recording your answers and reviewing the results in demo trading can help you evaluate support and resistance as part of a consistent method.


