

Forex
+100 Assets
Content table
5 hours ago
8 Minutes read
Written by Greenup24

A five-minute chart may look bullish while the one-hour chart shows price sitting just below a major resistance level. Looking only at the smaller chart could lead you to buy where there is little room for the move to continue. Constantly switching between charts can create a different problem: so many competing scenarios that making a decision becomes difficult.
Multi-timeframe analysis becomes useful when every chart has a clear purpose. In this Greenup24 guide, we use a practical framework: the higher timeframe establishes market context, the middle timeframe identifies the trading zone, and the lower timeframe helps assess the entry.
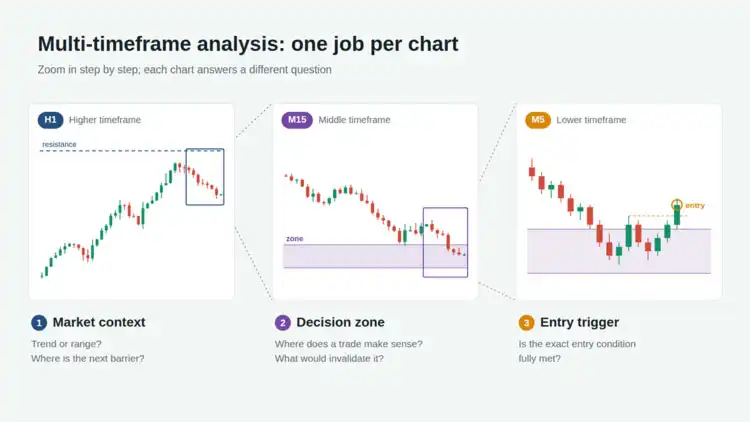
A timeframe is the period represented by each candle. On a one-hour chart, for example, each candle shows price activity over one hour. Multi-timeframe analysis means examining the same instrument across different chart periods to understand how shorter-term movements fit into the broader market structure.
A bullish four-hour chart and a bearish 15-minute chart are not necessarily contradictory. The shorter-term decline may be a pullback within a larger uptrend. It could also develop into a reversal. The purpose of the analysis is to define conditions for each possibility rather than assume that the broader trend must continue.
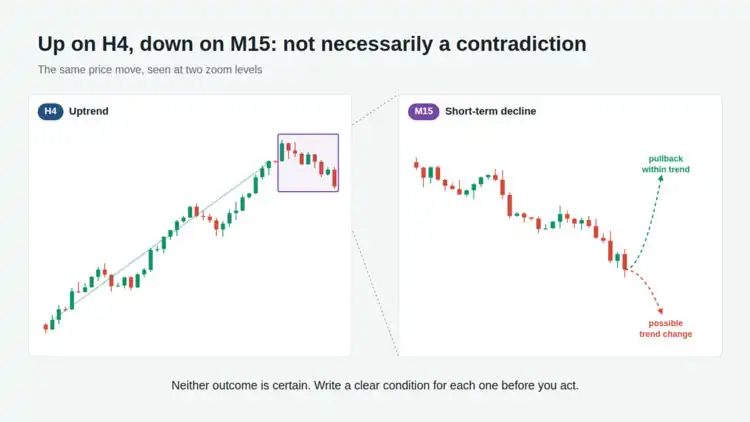
This approach places potential entries within the context of the larger trend.
Two or three timeframes provide a manageable starting point. Adding more charts does not automatically improve an analysis. Your choice should reflect your intended holding period and strategy rules; there is no single combination that suits everyone.
The following combinations are educational examples:
| Trading approach | Market context | Trading zone | Entry assessment |
|---|---|---|---|
| Short-term intraday trading | One hour: H1 | 15 minutes: M15 | Five minutes: M5 |
| Intraday trading with a broader view | Four hours: H4 | One hour: H1 | 15 minutes: M15 |
| Trades held over several days | Daily: D1 | Four hours: H4 | One hour: H1 |
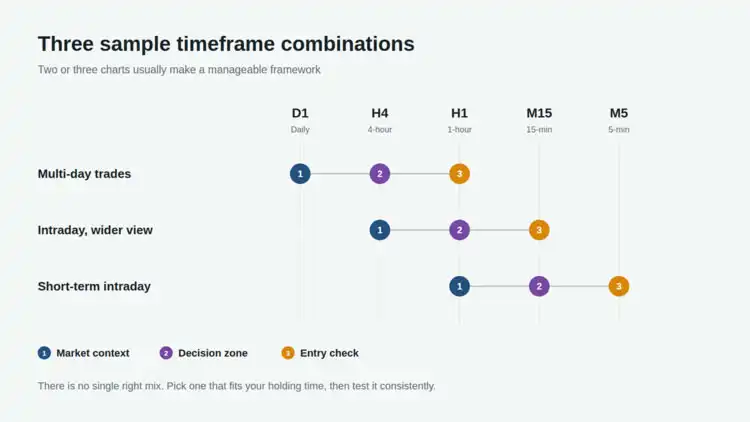
Choose a combination that fits your method and test it consistently. Repeatedly changing timeframes to find a chart that supports your preferred view makes performance harder to evaluate.
Before looking for an entry, answer three questions:
Higher highs and higher lows can indicate a bullish structure. Lower highs and lower lows can indicate a bearish structure. If price repeatedly moves between two boundaries without sustained progress, consider whether the market is ranging.
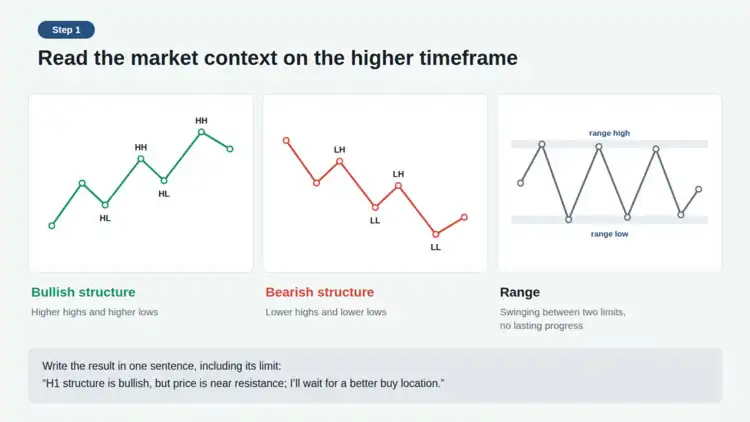
Write your conclusion in one sentence:
“The one-hour structure is bullish, but price is close to resistance, so I will wait for a more suitable buying opportunity.”
That sentence should capture the limitations of the setup as well as its direction. Calling a market bullish is not permission to buy at any price.
Next, decide where a trade would be worth considering. In an uptrend continuation setup, this could be an existing support area or a former resistance zone that price returns to test after a breakout.
Avoid drawing levels with more precision than the chart supports. Support and resistance are often better treated as zones because price does not always react at one exact number.
At the same time, define what would invalidate the setup. For example:
“If price closes below the support zone and fails to reclaim it, I will abandon this buying scenario.”
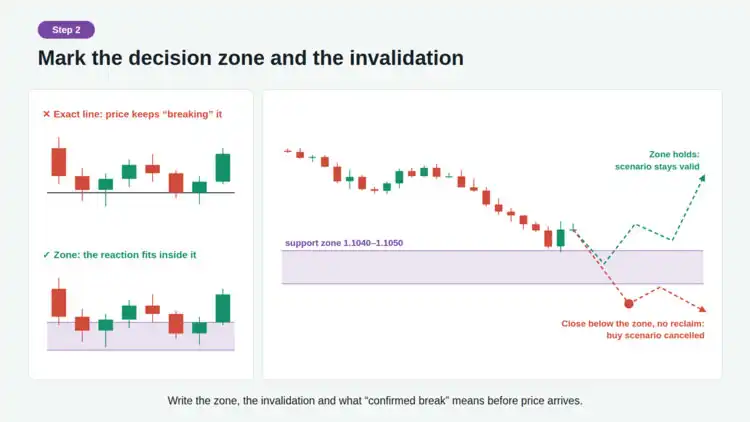
Terms such as “confirmed breakout” or “holding above a level” need clear definitions in your strategy. Specify whether you require a candle close, a breakout and retest, or another observable condition. Defining these rules after seeing the outcome makes the analysis subjective.
Once price reaches the zone, the lower timeframe provides a closer view of its behaviour. Reaching support does not establish that a reversal has begun; price can still break through it.
One testable set of buying conditions might be:
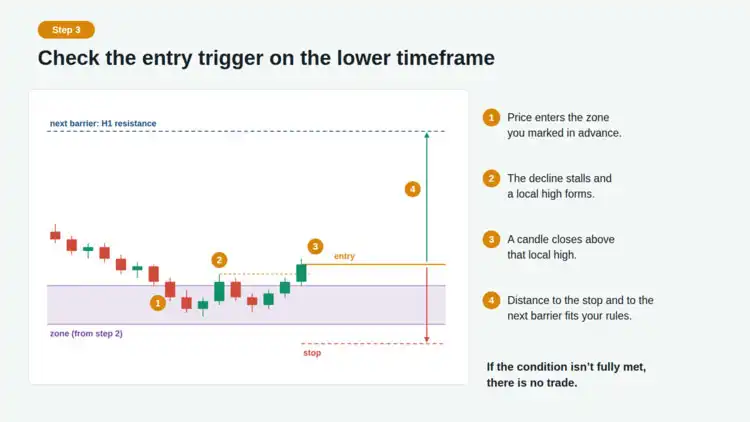
This is an example of how to define an entry trigger, not a strategy with established profitability. If the conditions are incomplete, there is no trade under these rules.
Also, a lower-timeframe entry does not automatically justify a very tight stop. The stop must fit the logic of the setup. Artificially tightening it to make the potential reward look larger can leave the position vulnerable to ordinary price fluctuations.
All prices in this example are hypothetical and do not constitute a trading recommendation.
Suppose EUR/USD has formed higher highs and higher lows on the one-hour chart, with the next resistance near 1.1090. Price begins a pullback, but the structure we are monitoring remains intact.
The scenario is to consider buying after the pullback, provided support holds and the entry conditions develop.
On the 15-minute chart, identify 1.1040–1.1050 as a potential support zone. Write down the entry and invalidation rules before price arrives, so the zone is not moved later to fit the market’s behaviour.
Price reaches the zone, then a five-minute candle closes above a local high. For a simplified calculation, assume:
| Trade component | Hypothetical value |
|---|---|
| Entry price | 1.1055 |
| Stop-loss price | 1.1035 |
| Stop distance | 20 pips |
| Profit target | 1.1085 |
| Distance to target | 30 pips |
| Risk-to-reward ratio before costs | 1:1.5 |
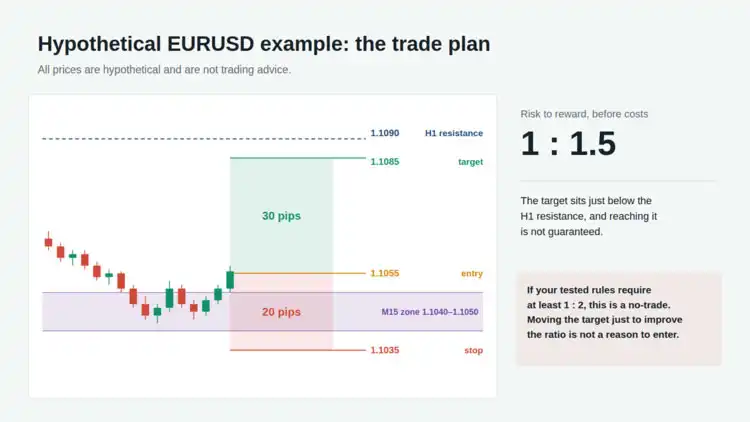
The hypothetical target sits slightly below the one-hour resistance. There is no guarantee that price will reach it.
If your tested rules require a minimum risk-to-reward ratio of 1:2, this setup does not qualify. Moving the target farther away simply to improve the ratio is not sufficient justification for taking the trade.
For a hypothetical $2,000 account with a chosen risk of 0.5%, the planned risk budget is $10. Assuming an approximate pip value of $10 per standard lot of EUR/USD in a US dollar account:
Position size before costs = $10 ÷ (20 pips × $10 per pip per lot) = 0.05 lots
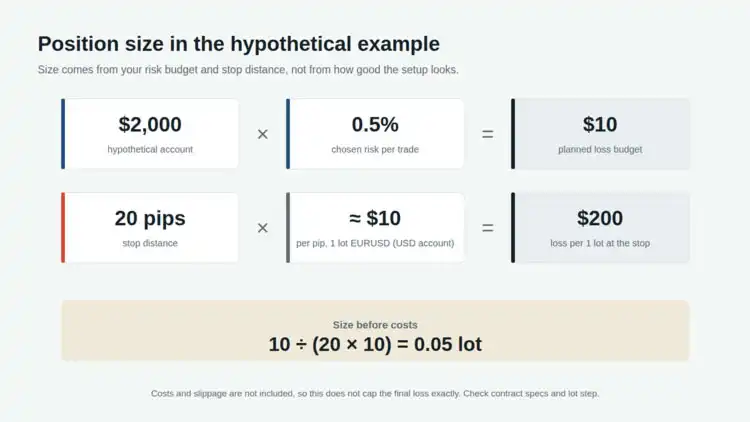
Trading costs and potential slippage must be included separately. This calculation therefore does not guarantee that the final loss will be limited to exactly $10. Check the instrument’s contract specifications and permitted volume increments on your platform.
Every chart does not need to point in the same direction at the same moment. The appropriate response depends on your strategy:
| Situation | Response within a trend-continuation framework |
|---|---|
| The higher timeframe is bullish, but the lower timeframe is bearish | Assess whether the decline is a pullback or has triggered invalidation; avoid rushing the entry |
| The higher timeframe is ranging, but the lower timeframe is bullish | Evaluate the move relative to the range high; a short-term rally does not necessarily establish a new trend |
| The lower timeframe gives a buying trigger near higher-timeframe resistance | Recalculate the available room and risk-to-reward ratio |
| The structure is unclear | Wait until the conditions become clear enough to apply your rules |
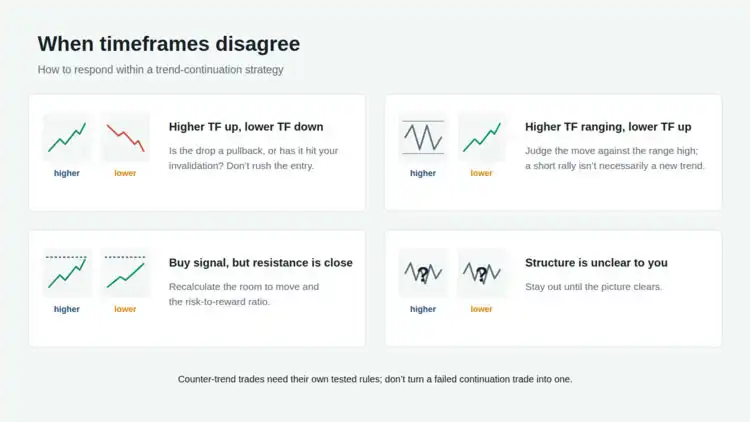
Trading against the broader trend can be part of a strategy, but it requires its own tested rules. An unsuccessful trend-continuation trade should not be reclassified as a countertrend trade after entry without a predefined plan.
Changing timeframes to justify a losing position. A trade based on five-minute structure is not justified simply because the daily chart remains bullish. Apply the management rules defined before entry.
Counting charts as independent confirmations. The same price movement may look bullish on both five-minute and 15-minute charts. These are two views of the same market, so agreement should not automatically be counted as independent evidence.
Relying on an unfinished candle. If your rules require a candle close, temporary changes in a developing candle do not satisfy that requirement.
Ignoring costs and economic releases. Multi-timeframe analysis does not remove the risks of news-driven volatility, wider spreads or execution at a different price. When targets are small, costs represent a larger share of the potential return.
Increasing size after seeing several confirmations. An attractive-looking analysis is not a reason to raise risk beyond your plan. Position size should follow the risk budget and stop distance.
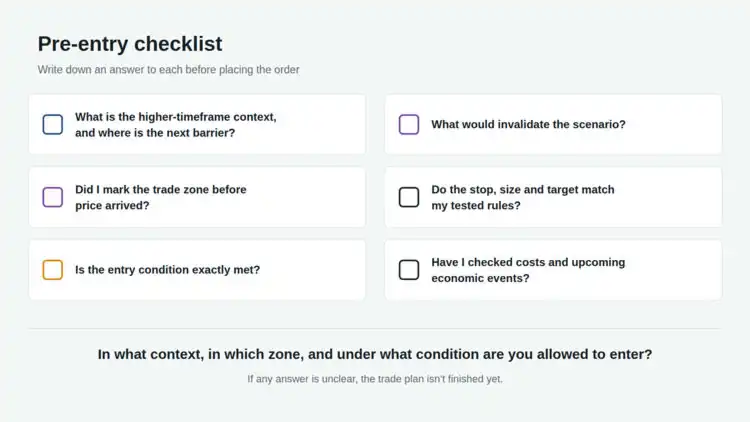
Before placing an order, make sure you can answer these questions:
For practice, choose one instrument and a consistent timeframe combination. Before the outcome is known, capture all three charts and write down your scenario. After the setup has played out, record both the financial result and how closely you followed your rules. This helps distinguish problems in market assessment, zone selection, entry timing and execution.
Multi-timeframe analysis supports decision-making when its output is clear: under which market conditions, in which zone and after which trigger are you allowed to enter? If any of those answers is missing, the trade plan is still incomplete.


