Forex
+100 Assets
Content table
10 mounts ago
5 Minutes read
Written by Greenup24
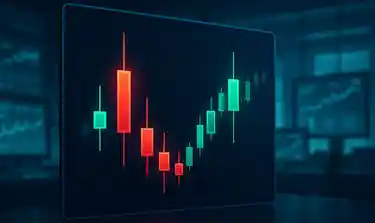
Candlesticks are among the most common and practical tools in Forex market analysis, helping traders visually and intuitively follow price movements. These charts provide detailed information about market behavior over any given time frame including price range, prevailing trend, and potential areas of reversal or continuation.
In addition, candlesticks can offer signals for trade entries and exits through specific patterns or serve as a complement to other analytical methods. The ability to quickly gauge market sentiment just by observing the shape of a candlestick is an advantage that many other tools do not easily offer.
Candlestick charts have deep historical roots in trading. This method of price analysis was first developed by Japanese rice merchants in the 17th century to track rice prices. With the evolution of global financial markets, it later became a key instrument in technical analysis.
Candlesticks are drawn based on an asset’s price behavior over a defined time frame.
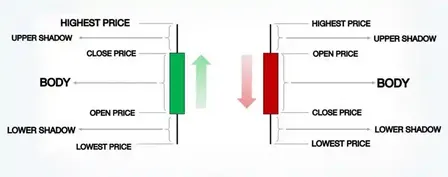
Each candlestick consists of two main components:
Traders can utilize candlesticks across various timeframes (from daily to intraday) to identify trends, reversals, and optimal entry and exit points.
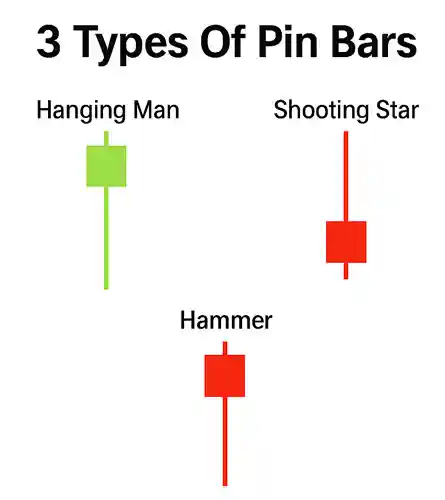
Some of the most common candlestick patterns include:
These patterns, when combined with complementary analyses, help traders evaluate trading opportunities more accurately and build more precise strategies.
In technical analysis, candlesticks are one of the most widely used and reliable charting tools for interpreting price behavior. Each candlestick represents a specific time interval and displays information such as the opening, closing, highest, and lowest prices.
The shadow of a candlestick a critical component especially for professional traders shows the extent of price fluctuation during the timeframe and the points at which the market reacted.
This information can serve as the foundation for more accurate trading decisions, especially around support and resistance zones or when reversal patterns form.
Shadows are thin lines that extend from the body of a candlestick upward or downward, indicating price movements beyond the open and close levels.
In other words:
There are two types of shadows:
Shadows reflect temporary strength or weakness of buyers and sellers within a specific time period.
In many cases, candlesticks with long shadows suggest high volatility, market uncertainty, or strong psychological pressure at certain price levels.
One of the key applications of shadows in technical analysis is identifying hidden support and resistance zones.
When multiple candlesticks form long shadows in specific areas, those zones likely hold psychological significance or hidden orders. These can be ideal points for entry, exit, or placing stop-loss levels.
Shadows in candlestick charts are simple yet highly important tools for understanding the behavior behind price movements. The better you understand how shadows form and their place in candlestick structure, the deeper your grasp of trader sentiment and market behavior will become.
Professional shadow analysis not only aids in identifying more precise entry and exit points but also enhances your ability to interpret market psychology.
If you want to learn how to practically use candlesticks, create your trading account today at GreenUp24.com.