Forex
+100 Assets
Content table
8 mounts ago
5 Minutes read
Written by Greenup24
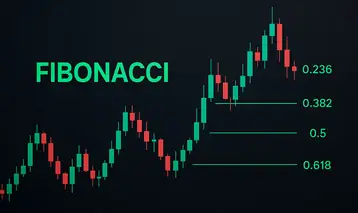
In technical analysis, the Fibonacci Retracement tool is one of the most popular methods used to identify potential support and resistance levels. Based on the mathematical Fibonacci sequence, this tool helps traders locate possible areas where price might reverse or continue its trend.
It’s important to note that Fibonacci is not a prediction tool; rather, it’s a framework that helps traders understand market behavior and spot price zones where a reaction is more likely to occur.
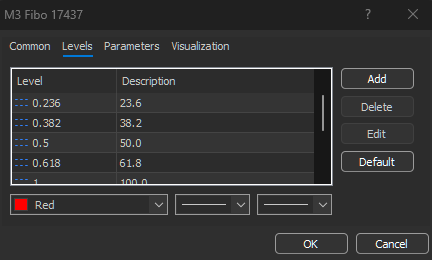
The main Fibonacci retracement levels are 23.6%, 38.2%, 50%, 61.8%, and 78.6%. Each percentage represents how much of the previous move the price has retraced.
For example, if the price in an uptrend moves from 1.2000 to 1.2500, a retracement to the 61.8% level would mean a correction to around 1.2300 — a level where buying pressure may return and the uptrend could resume.
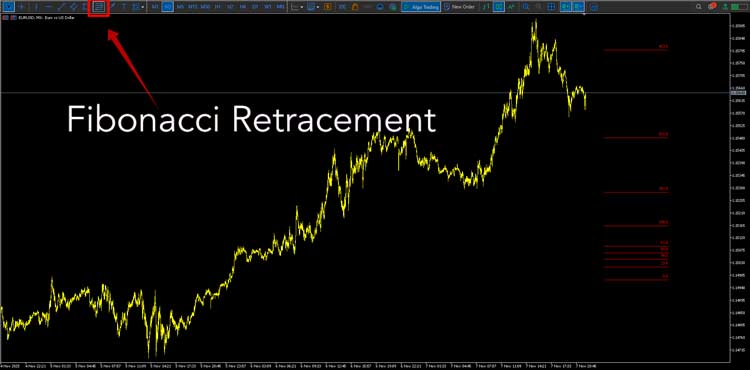
Using Fibonacci is simple but powerful:
The resulting horizontal lines highlight areas where price may stall or reverse, helping traders plan their entries and exits with better precision.
When the price approaches a Fibonacci level, traders look for confirmation signals before acting:
However, relying on Fibonacci alone can be risky; it should always be combined with other technical tools for confirmation.
To increase the reliability of Fibonacci levels, combine them with additional indicators or signals:
These confluences help filter out false signals and improve decision-making accuracy.
Fibonacci tools aren’t only useful for identifying setups — they also help manage risk effectively:
This approach ensures that traders have a clear entry and exit plan, which is one of the most important principles of professional trading.
Even experienced traders can misuse Fibonacci tools. Here are some common errors:
Learning to draw Fibonacci correctly and waiting for price confirmation is the key to using it effectively.
Fibonacci Retracement is a powerful analytical tool that helps traders identify potential reversal zones and plan trades with clear structure and discipline.
Although no single indicator guarantees success, combining Fibonacci with other tools and following sound risk management principles can significantly increase your chances of consistent profitability.
At GreenUp24, you can access professional charting tools, advanced analytics, and dedicated Persian-language support — enabling you to test and apply your Fibonacci strategies in real market conditions with confidence and precision.