Forex
+100 Assets
Content table
4 mounts ago
4 Minutes read
Written by Greenup24
Financial markets are always in motion — sometimes they rise strongly, sometimes they experience sharp declines, and at other times they fluctuate within a defined range.
Understanding these directional movements is the foundation of Trend Trading, a popular approach among traders that, however, is not suitable for everyone.
In this comprehensive guide, we explain in simple terms:
Trend Trading is a method that focuses on identifying the overall direction of the market and trading in that same direction.
The core idea is simple:
Prices tend to move in a specific direction for certain periods of time.
Traders aim to align themselves with that movement rather than trade against it.
Trends are generally classified into three categories:
An uptrend occurs when prices form:
In this case, the market is considered bullish.
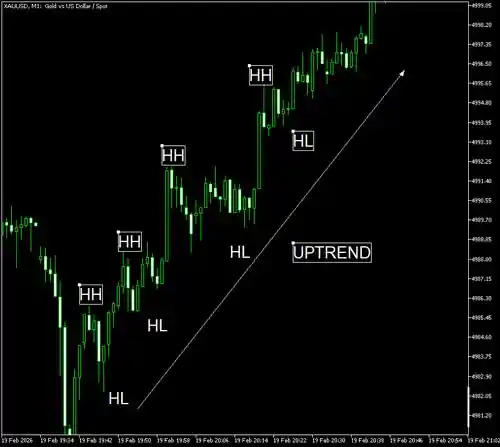
Simple example:
If price moves from 50 to 55, then to 60, and the pullbacks occur at 52 and later 57, both highs and lows are increasing — indicating an uptrend.
In a downtrend, prices form:
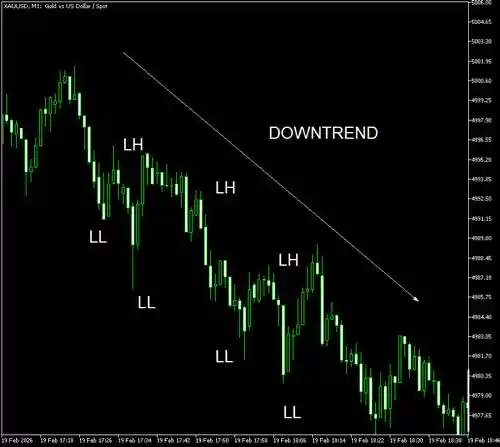
For example, if price falls from 80 to 75, then to 70, and each corrective move peaks at a lower level than before (77, then 72), this signals a downtrend.
When price moves up and down within a defined range without forming new highs or lows, the market is in a sideways or ranging phase.
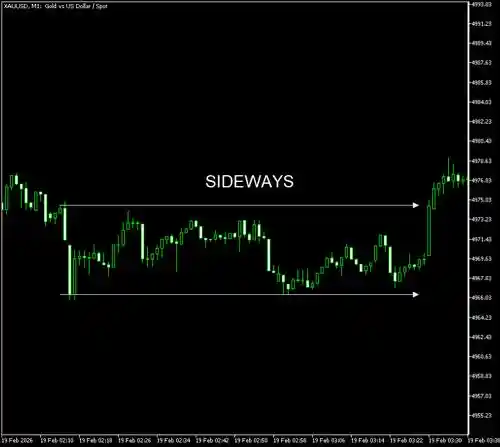
For instance, price fluctuating between 40 and 45 without breaking either level.
In such conditions, trend-based strategies usually perform poorly.
The simplest method is analyzing highs and lows on the chart:
This is the most basic form of trend analysis.
A trendline is drawn by:
A break of a trendline may indicate weakening momentum, but on its own it is not a definitive signal.
Moving averages smooth out price fluctuations.
A common example is the 50-day and 200-day moving averages.
Note: Moving averages are lagging indicators and do not predict the future.
Combining these tools provides a more comprehensive view of market direction.
No trend lasts forever.
Potential signs of trend exhaustion include:
If price continues to rise but volume decreases, the trend may be losing strength.
Failure to break an important resistance level can indicate weakness.
Important note:
No signal is guaranteed. The market can always surprise traders.
Entering when price breaks a key support or resistance level.
Goal: Capturing the beginning of a new trend.
Entering during a temporary correction within a strong trend.
Risk: The pullback may turn into a full reversal.
Entering when price momentum is strong (using RSI, MACD, volume).
Best suited for volatile markets.
Signals based on crossovers of short- and long-term moving averages.
A systematic approach, but inherently lagging.
Risk management is absolutely critical in this trading style.
Trend Trading is one of the most structured approaches to trading financial markets. By learning how to identify trends, recognize signs of weakness, and apply proper risk management, traders can make more informed and disciplined decisions.
However, no strategy guarantees profits. Success in the market requires education, practice, and personal discipline.
If you are looking to trade in a professional and user-friendly environment, GreenUp24.com can provide a suitable platform for accessing global markets and implementing trading strategies such as Trend Trading. Choosing a reliable broker alongside solid knowledge and risk management can play a crucial role in your trading journey.