Forex
+100 Assets
Content table
7 mounts ago
5 Minutes read
Written by Greenup24
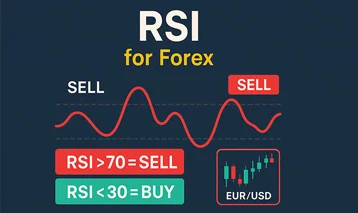
The Relative Strength Index (RSI) is one of the most widely used indicators in technical analysis, introduced by J. Welles Wilder Jr. in 1978. This tool measures the strength of price movements and helps traders determine whether an asset is in an overbought or oversold condition.
RSI is a type of momentum oscillator that fluctuates between 0 and 100, allowing traders to assess whether the current trend is likely to continue or if a reversal may be approaching.
RSI helps traders evaluate the strength of buyers and sellers without relying solely on price action.
The main RSI formula is:
RSI = 100 - (100 / (1 + RS))
Where: RS = Average Gain / Average Loss (typically over a 14 period window)
In simple terms:
Indicates strong buying pressure and a potential price correction. In strong trends, RSI may stay above 70 for extended periods so it should be evaluated alongside candlestick patterns and volume.
Indicates excessive selling pressure and a potential reversal or correction. If accompanied by bullish candlestick patterns or rising buying volume, the probability of a rebound increases.
Level 50 is the midpoint.
Bullish Divergence: Price forms a lower low, but RSI forms a higher low → Possible bullish reversal.
Bearish Divergence: Price forms a higher high, but RSI forms a lower high → Possible bearish reversal.
Bullish Failure Swing: RSI rises from below 30, forms a peak, retraces, and then breaks above its prior peak → Buy signal.
Bearish Failure Swing: RSI drops from above 70, forms a bottom, retraces upward, and then falls below its prior low → Sell signal.
RSI on short timeframes (5 or 15 minutes) helps spot fast reversals. A move from below 30 upward may mark the start of a short-term rally.
In strong uptrends, RSI tends to stay above 40, and in downtrends, it often stays below 60. RSI divergences on higher timeframes hold greater significance.
Weekly and monthly RSI helps identify undervalued assets. An RSI below 30 in a bullish macro trend may indicate a long term buying opportunity.
The Relative Strength Index (RSI) is one of the simplest yet most effective tools in technical analysis. When properly configured and used alongside other indicators, RSI can provide highly accurate entry and exit signals.
However, RSI should not be used in isolation. Combining RSI with trend analysis, volume, and price action patterns yields the best results.
With GreenUp24’s advanced charting tools, analytical features, and Persian speaking support, traders can effectively apply RSI based strategies in real market conditions and enhance the quality of their Forex trading decisions.