

Forex
+100 Assets
Content table
3 mounts ago
5 Minutes read
Written by Greenup24
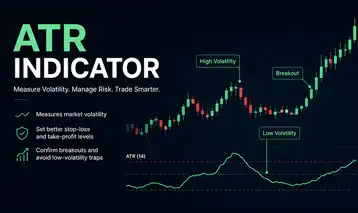
If you've spent any time in the financial markets, you know that some days are dead quiet, while others are wild rides with massive price swings. The ATR indicator (Average True Range) is the perfect tool for measuring this market environment. It acts as a ruler, giving you an exact reading of market volatility.
Developed by the legendary technical analyst J. Welles Wilder in 1978 (the mind behind RSI and Parabolic SAR), the ATR measures how much an asset moves, on average, over a specific period.
⚠️ The Golden Rule of ATR: The ATR is completely direction-blind. It does not tell you whether the price will go up or down. A rising ATR simply means a storm of volatility is hitting the market (up or down), while a falling ATR means the market is calming down or consolidating.
To account for market gaps (which normal high-to-low ranges miss), Wilder introduced the concept of the True Range (TR). For every single candle, the indicator calculates three values and picks the largest one:
TR = Max ( High−Low , |High−Previous Close| , |Low−Previous Close| )
Then, the indicator calculates a moving average of these TR values over a specific period—14 periods being the industry standard:
ATR = Moving Average ( TR , 14 )
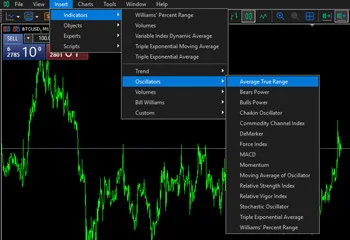
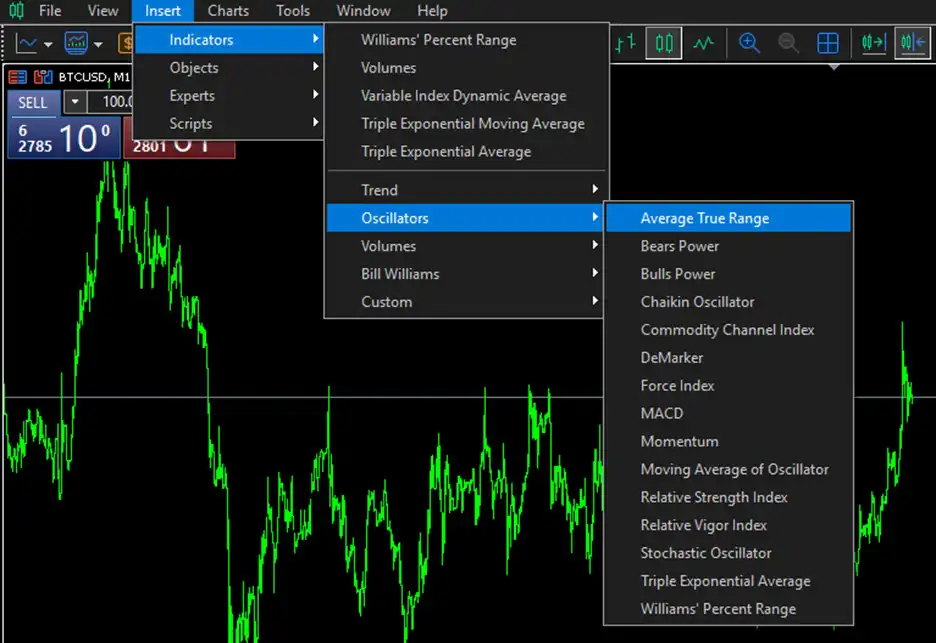
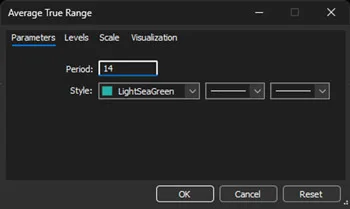
The ATR is a built-in tool found under Indicators → Oscillators in both MT4 and MT5. It has one primary setting: Period.
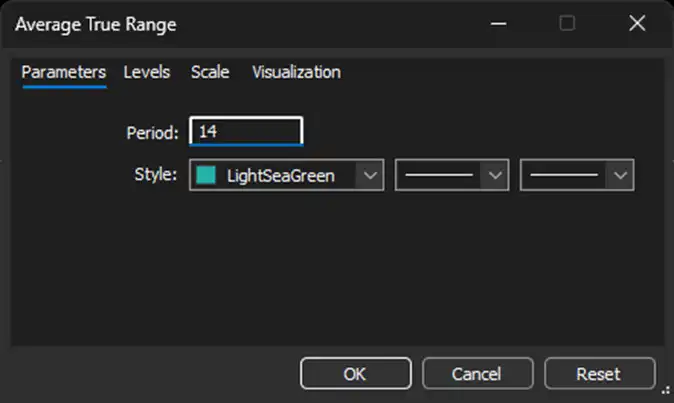
Instead of just looking at the line, here is how you can use the ATR to directly improve your risk management and profitability:
A common rookie mistake is using a fixed pip/dollar stop loss (e.g., always 20 pips). The market is alive, and your stop loss should adapt to its mood. The mathematical formula for an ATR-based stop loss is:
For Long (Buy) Positions: Stop Loss = Entry Price − ( ATR × Multiplier )
For Short (Sell) Positions: Stop Loss = Entry Price + ( ATR × Multiplier )
Example: You buy Gold at $2300, and the current ATR is 5. If your strategy uses a 2x multiplier, your stop loss will be: 2300 − (5 × 2) = 2290. This places your stop loss safely outside the natural "noise" of the market, preventing you from getting stopped out prematurely.
When the ATR line trends downwards and flattens out at relatively low levels, it means the market has run out of momentum. During these phases, trend-following strategies perform poorly. The market is either consolidating or moving sideways (ranging).
Every asset has a typical daily capacity for movement. If Bitcoin's daily ATR is $2,000, and it has already moved $2,000 today, the market has exhausted over 70% of its average daily range. Entering a trade in the direction of the trend at this point is highly risky because the buyers/sellers are likely tired.
When the price breaks through a major support or resistance level, look down at your ATR. If the breakout occurs alongside a sharp, aggressive spike in the ATR line, it confirms that real volume and volatility are backing the move, significantly reducing the chances of a fakeout.
| Pros | Cons |
|---|---|
| Best tool for setting scientific, volatility-adjusted stop losses. | No Directional Bias: Does not give direct buy or sell signals. |
| Adapts automatically to changing market conditions. | Can be a lagging indicator due to its moving average nature. |
| Works seamlessly across Forex, Crypto, Stocks, and Commodities. | Prone to noise and false spikes on ultra-low timeframes (e.g., 1-minute chart). |
The ATR is not a standalone trading system; it is a system optimizer. The most effective way to trade with it is to use Price Action (Support/Resistance) to find your entry point, and then use the ATR to place your stop loss and take profit precisely. Combining it with trend indicators like a Moving Average (MA) perfectly covers the ATR's blind spot regarding market direction.


